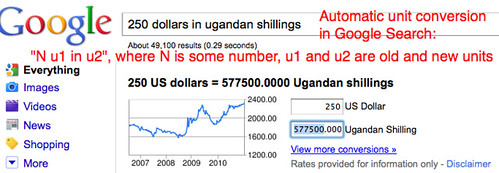
Unit conversion in Google search is very cool. Type in “1Kg in pounds” and automatically get “1Kg = 2.2 lbs” (or something like this.) If you didn’t know, now you do.


Jan 04
Unit conversion in Google search is very cool. Type in “1Kg in pounds” and automatically get “1Kg = 2.2 lbs” (or something like this.) If you didn’t know, now you do.
Jan 04
I’ve not used cell phones in the classroom much. (I did use cell phones in an outdoor water quality mapping project for middle school students, which worked like a charm.) But it seems way past time to talk about why this is so. Kids are cell phone natives, and most professional people today are, too. It is strange indeed that a nation so (rightly) concerned for the quality of K-12 education should work without one of its most prolific technology resources, fighting with one hand tied behind its back. Yet that’s what we do.
Listen to the voices of a couple of teachers experienced with using cell phones in classrooms in the video above. As someone who has used web 2.0 resources extensively in the classroom, what they say about the use of cell phones rings true to me. The arguments against using web 2.0 resources seem just as strong up front, and just as hollow after serious attempts to overcome them, as do concerns over cell phone use. gtg:)
Dec 29
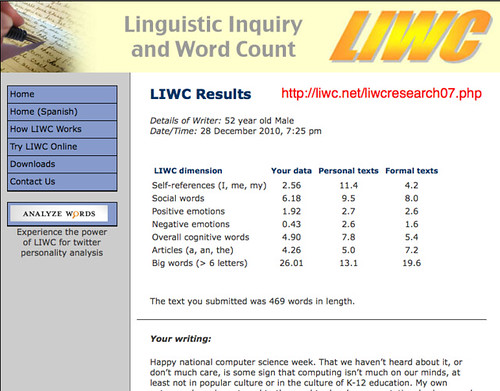
Facebook released data this week about how people write online (well, on Facebook.) The stats are interesting, but not very: young people talk about themselves and school more, and (editorializing) are less careful about what they say or how they say it… The real interest for me was the tool they used for gathering this data: the Linguistic Inquiry and Word Count software, which you can use at the basic level for free online. (You guessed it: click the image to try your hand.)
I write like an old guy. Big words, little emotional content. Coulda toldya. But now I’ve got a tool for measuring what I write. So do you. Let the fun begin.
Dec 16

NDeRC’s ASTRO collaboration has 30 Galileoscopes available for classroom use. Below is repeated a post to an astronomy program listserve from Ardis Herrold, a teacher I worked with in the NOAO/NASA Spitzer Teachers observing program. The time is quite short for two upcoming categories (ending Jan 21, 2011), but there are other, later categories, and it could be a lot of fun. Galileoscopes could be sent home with interested students over the holidays. Promoting such a contest locally was one of the reasons we accepted the 30 Galileoscopes offered to us, and now these clever Earth Science teachers have created a national version. Should be fun.
—-
from Ardis Herrold, President, NESTA and Spitzer Teacher alumnus:
Galilesocope users, take note! The National Earth Science Teachers Association (NESTA) and the National Optical Astronomy Observatories (NOAO) announce the opening of three Galileoscope Observing Contests. The contests are open to students in grades 12 and under. There are two categories in each contest: Sketches and Images. The first two targets are the Moon and Jupiter. These contests run through January 21, 2011. The total lunar eclipse next week would be an excellent opportunity to use Galileoscopes and enter the contest. A third contest, “Galileo’s Choice” is also now open for observing other objects and concludes in April. NESTA will maintain an ongoing Galileoscope Image Gallery of entries as the contests progress. Prize packages will be awarded by NOAO and will include a number of items such as a book, poster and a planisphere. Winners will receive publicity through the NESTA web site and also have their work published in the Earth Scientist. Full contest details may be found at:https://www.nestanet.org/cms/content/galileoscope-observing-contests.
Dec 14
Predictive Modeling Isn’t Magic – Technology Review.
Here’s an interview with someone who does predictive modeling for a living. During the interview he discusses agent modeling, which models systems by creating a story in which agents interact in relatively simple ways with their neighbors and instructing a computer to calculate the net effect of many such interactions. The world can be modeled–represented to human beings as rich analogies–in this way. Every middle and high school student can grasp this.
At the recent Supercomputing Education Program in New Orleans, Bob Panoff of the Shodor Educational Foundation advanced his campaign to open up the world of computational modeling first for K-12 teachers, and then for students. Here’s a screengrab from his outline for one of those talks, all of which are fully available online:

Agent modeling can be introduced in K-12 in fairly simple ways. At the SC10 Ed Program, Agent Sheets was introduced to K-12 educators as a way of inviting students into computation through agent modeling. Here’s a link to my notes from that event, walking through the basics of modeling in Agent Sheets using the frog-and-the-prince story. In that story, a (red) witch that turns a (blue) prince into a (green) frog, and a (pink) kissing princess that turns the frog back into a prince. Change the witch to a bacteria, the princess to an antibiotic, and the prince into a patient, and you’ve begun to model certain kinds of disease transmission. Add many of each kind of agent (witch:princess:prince::bacteria:antibiotic:patient), and you’re modeling (at first, quite simply) the spread of an epidemic.
These notes are embedded in a computationalscience.michianastem.org wiki, which currently includes a copy of Shodor’s useful list of resources and my notes on Agent Modeling. As you might discern from my choice of venue for those notes, it is my hope that attention to computational science becomes a regular part of Michiana STEM culture, even K-12.
Dec 10
The images in this slide show were taken from the Cloning a Fluorescent Gene activity at Saint Joe High. (Who knows how that image of a larger life form got in there:) Enjoy.
Dec 10
My daughter Liz sent me a link to this presentation. It’s a nice illustration of the age that’s coming…that’s here. Get your data on.
Dec 09
Happy national computer science week. That we haven’t heard about it, or don’t much care, is some sign that computing isn’t much on our minds, at least not in popular culture or in the culture of K-12 education. My own antennae have been tuned to the need to develop computational science and engineering literacy first through my years of teaching Engineering Ethics just out of graduate school, but much more recently through my affiliation with the Education Program of the Supercomputing conference series. As technology revolutionizes the ease with which data is gathered and analyzed, it becomes more important to be able to make sense of it, and to appreciate what’s under the hood of the data delivery systems we’ll encounter. Tim Berners-Lee has recently argued that data mining is the new stock in trade even for journalists. Those of us reading what scientists, engineers, or even well-educated journalists pull together have got to be well-enough acquainted with the processes involved that we do not feel alienated from them.
Earlier this month I traveled to New Orleans to attend SC10 to reestablish my connection with colleagues in the education program. (The image set embedded above are just a few slices from that trip.) We are collaborating with some of these folks on a proposal to foster computer literacy in K-12 schools here in Michiana. Whether we’re funded this round or some other, we’ll stay with the effort. We’ve got to. Our experience building integrated STEM community has made it clear that one defining cultural difference separating STEM professionals from K-12 students (and often teachers) can be illumined by one single question: do you have any data that matter to you? STEM professionals typically do, whereas pre-college folks typically don’t. And since they don’t have data that matters to them much, neither do data analysis tools much matter outside of STEM professional circles. They may have some exposure to some of these tools, but few (with exceptions) are much excited about Excel…let alone MATLAB, or C++.
But that can change. Tools for gathering and processing data are becoming widely available and easier to use. Just below is a map of plants gathered by school children in Northern Uganda. There’s something about noticing your world and sharing about it online that increases the value of our surroundings. All of the tools used to generate this map and data associated with it can be assembled by anyone, for any purpose. Watch carefully: data that matters is coming to a venue near you. Citizen science. Citizen journalism. Digital ethnography. Let’s build a community that prepares its citizens for this age of data analysis by helping motivate students to peek under the hood.
Dec 08
Data visualization is a really big deal. It always was, but the amount of data available is increasing at an accelerating pace, and thus the need for tools to represent and illuminate data is also growing ever faster. Some of those tools involve story-telling, where meaning is communicated. Some of them involve visualization technologies, in the broadest sense where there the senses are engaged to aid in understanding. Here’s a very nice example of a story told effectively with data visualization technology. Both the story told and the medium used to tell it make it worth the five minutes or so needed to come to some understanding.