

2010-10-22_1204, originally uploaded by NDeRC2.
Plato has Socrates show us, through the famous geometrical discussion with a young servant boy in the Phaedo, that entering into confusion is the beginning of learning. I’m thus pretty excited, because I’m about to learn somthing. I’m deliciously confused, and I’ve managed to pin the cause down with some precision.
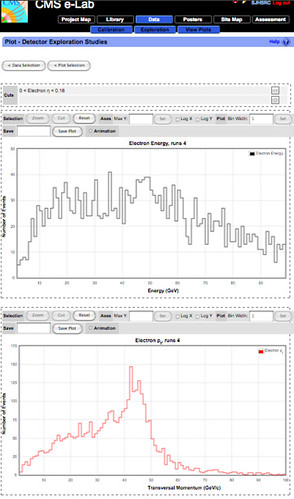
Above are two plots that are not alike, but that I would have (I’m about to learn, naively) expected to be alike. I was attempting to demonstrate the power of the cutting tool in the CMS e-Lab, an online learning environment where pre-college students and teachers can get their hands on real particle physics data and analysis tools, together with the scaffolding they need to appreciate it. (Check it out here, hitting the “login as guest” link to get in.) What I expected to be able to show was that if I select (by imposing a “cut”) a subset of the data which was (SIMULATED AS) recorded in areas of the detector at right angles to the beam line, I should then have particles all of whose momentum is at right angle to the beam line, and thus for whom transverse momentum was close to total momentum. That subset should have transverse momentum (~its total momentum) near to the total energy, since energy (using units where the speed of light is set equal to one, as particle physicists regularly do) just is the square root of the sum of the momentum squared plus the rest mass squared, and since the rest mass for electrons is negligible compared to the kinetic energy (and thus the momentum) of these high energy collision products.
But in fact what I see, after applying the cut on the angle (and verifying that it had a reasonably expected impact on the two plots of reducing the total numbers of events), are two very different plots. They neither rise the same, nor fall the same. (I set both sets of X axes to the same 100 GeV energy range. (It would have been helpful to put both of these plots on the same axis, but that feature was hiccuping for this set of plots, for some reason.)
Perhaps there is something about the electron calorimeter that I need to realize. I do know that electrons shower in the calorimeter, which might flatten out the curve, because once they shower, little of their momentum (relatively) is orthogonal to the beam line, and so the reconstruction of the total energy for those particles would include energy deposited in neighboring sections of the subset of the detector than those on which I triggered by making a high transverse cut. But it’s still not coming together for me; I’m pretty stumped. I articulate my confusion here in hopes that some Socrates (NDeRC Fellow Jame Antonelli, perhaps?) will come to my assistance by asking me the right next question.