

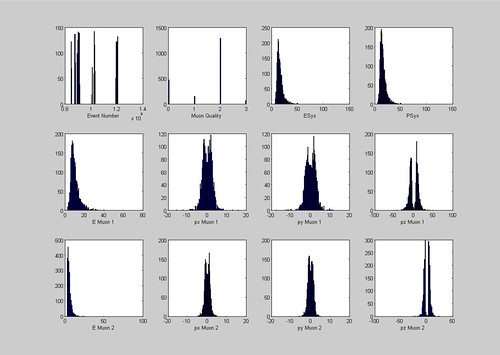
Example Set of Histograms (2000 data pieces)
Students in the CMS Data group at QuarkNet began a new project in analyzing data last week and will continue it into the next few weeks. They began by learning both the basics of the CMS detector at the LHC and the basics of MatLab. This computer program is brand new for most of the students working in this group and can get complicated. I have been working with this group and can personally speak on just how complex the program is for someone who has never used something like it before.
Students will implement MatLab to analyze a group of a hundred thousand data plots from the CMS detector. The program can do a multitude of things with this data such as making it more visual by printing out graphs and histograms of this information such as the one above. Once the data is in the program, students can analyze the data plots looking for patterns or anything that might be of interest to physicists.
A hundred thousand pieces of data is certainly a lot to look at but who knows what they may find. The students may make some important discoveries from this data.